


Bitcoin’s price recovery gathered pace on Friday, helping the cryptocurrency erase a significant chunk of the recent drop.
The top cryptocurrency by market value jumped to an eight-day high of $6,943 at 10:30 UTC, having started rising from $5,400 Thursday, according to CoinDesk’s Bitcoin Price Index.
The solid gains have seen bitcoin claw back a hefty 46 percent of the drop from $10,500 to $3,867 witnessed in the four weeks to March 13. At press time, bitcoin is trading near $6,865, a 27 percent gain on a week-to-date basis.
The rebound seen in the last 36 hours had been expected, with technical charts reporting seller exhaustion. The cryptocurrency had also been looking undervalued as per the market value to realized value (MVRV) Z-score.
The cryptocurrency still looks underpriced at press time, with the Z-score hovering below zero, according to Glassnode data. That bodes well for a continued rally.
Meanwhile, speculators may put a bid under BTC in anticipation of a big buy order, as Tether, the company behind the tether (USDT) stablecoin, has minted over $120 million coins in the last 48 hours, according to Simon Peters, crypto market analyst at investment platform eToro.
The fundamentals are looking better, too with fiscal authorities across the globe injecting massive amounts of liquidity to counter the coronavirus-led slowdown in economic activity.
The U.S. Federal Reserve’s balance sheet increased to record high $4.7 trillion this week. The U.S. central bank also cut rates to zero on Sunday, having injected liquidity worth $1.5 trillion into the system last week.
“We’re going to be in a period of zero rates for a long time. We could see Bitcoin act as a global inflation hedge due to many aggressive stimulus packages being implemented,” Richard Rosenblum, co-head of trading at crypto liquidity provider GSR told CoinDesk.
What’s more, the traditional markets are showing signs of stability. The major European equity market indices are flashing green for the second consecutive day and futures tied to the S&P 500 are up 4.45 percent.
That could invite stronger buying pressure for bitcoin. Ever since the global market shakeout, the cryptocurrency has been moving strongly in tandem with the equities market.
The technical charts, too, suggest scope for a continuation of the recovery rally.
Hourly chart
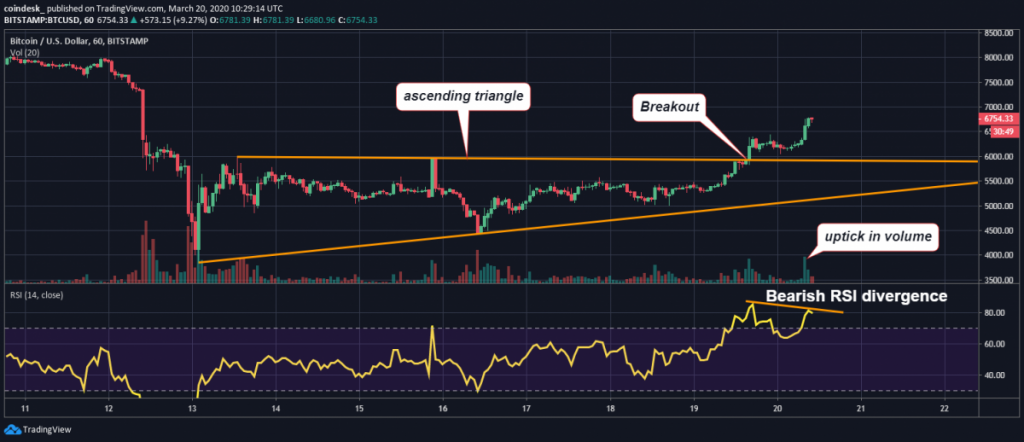
The ascending triangle breakout at 09:00 UTC was backed by an uptick in trading volumes and has put the bulls back in the driver’s seat.
The cryptocurrency could soon challenge resistance at $7,000. A violation there would open the doors to $7,400.
If prices fail to keep gains above the support at $6,425 (December 2019 low), the bearish divergence (lower high) of the relative strength index (RSI) would gain credence and a pullback to $6,000 could be seen.
Daily chart
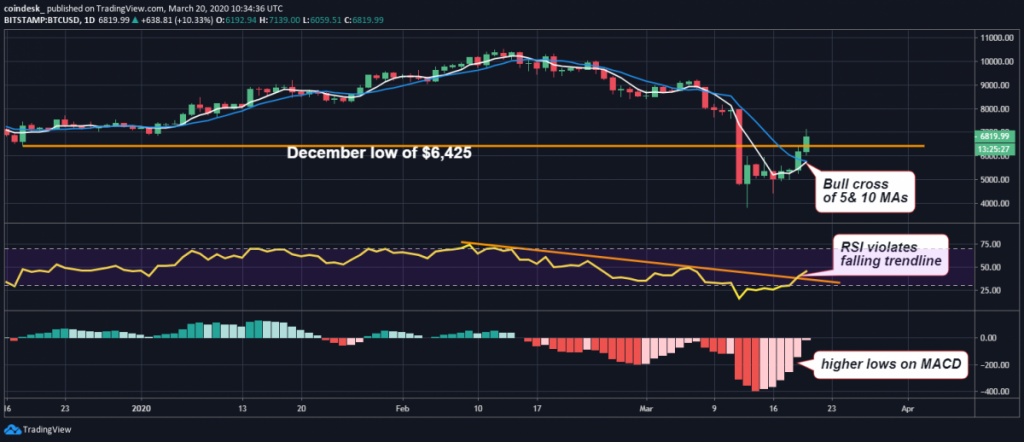
The daily MACD histogram continues to produce higher lows below the zero line, indicating dropping bearish momentum. Meanwhile, the 5- and 10-day averages are teasing a bullish crossover.
The relative strength index has violated the descending trendline in favor of the bulls.
All in all, the daily chart indicators are calling further gains. However, the cryptocurrency is not out of the woods yet, eToro’s Simon Peters told CoinDesk, while adding that bitcoin needs to print more prominent higher highs and higher lows to give us more confidence.
Essentially, Peters wants to see if there is a dip demand, which would create a higher low.


